AQCNZ Tools
AQCNZ Tools is a web-based platform developed by Air Quality Consulting NZ to support air quality monitoring, data analysis, and reporting. The platform brings together a suite of practical tools used in environmental monitoring projects, enabling efficient data review, analysis, and reporting.
Access the dashboard here:
Launch AQCNZ Tools
Windrose Tool
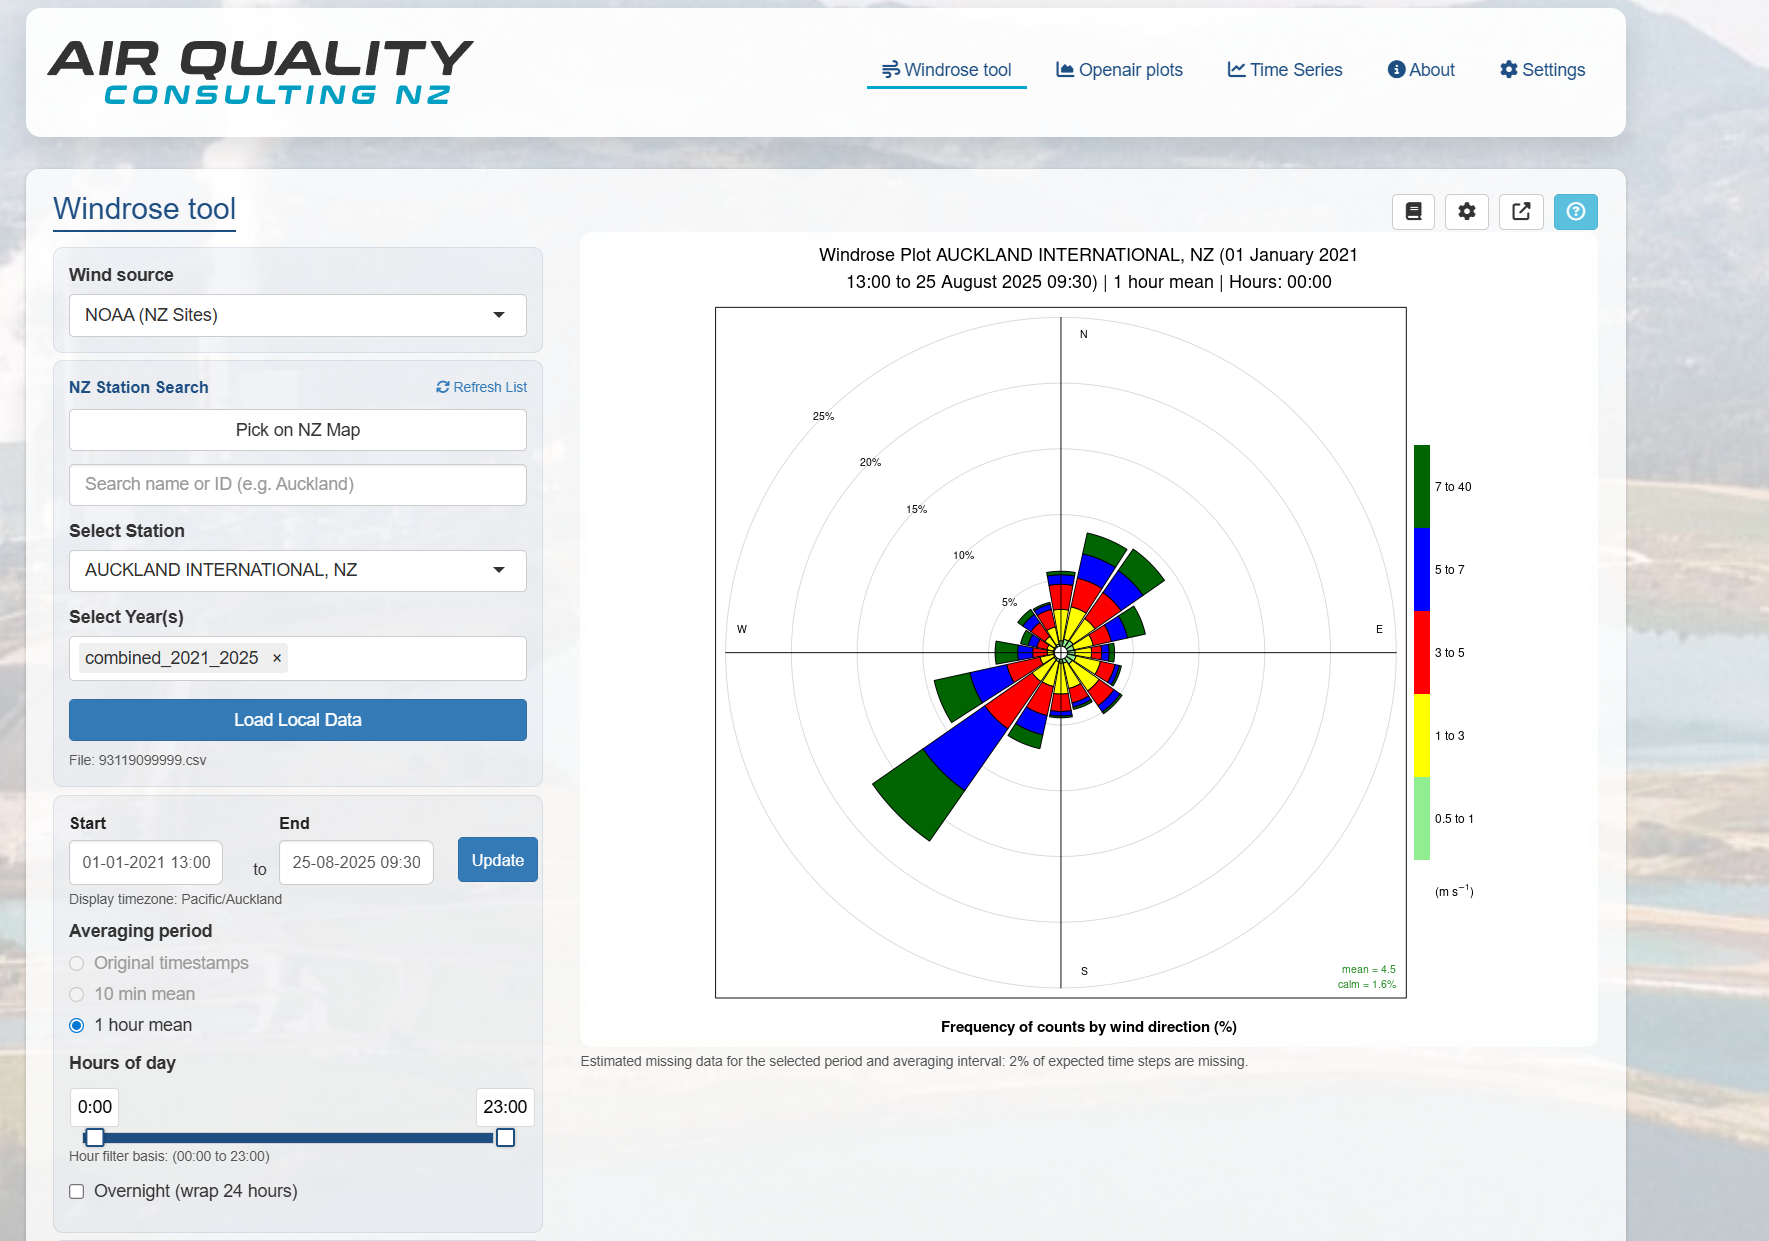
The windrose tool is designed primarily for user-uploaded monitoring data, allowing flexible analysis through selectable averaging periods and time-of-day filtering. Optional access to NOAA meteorological data is also available, including both global datasets and New Zealand-specific stations.
Windrose Map
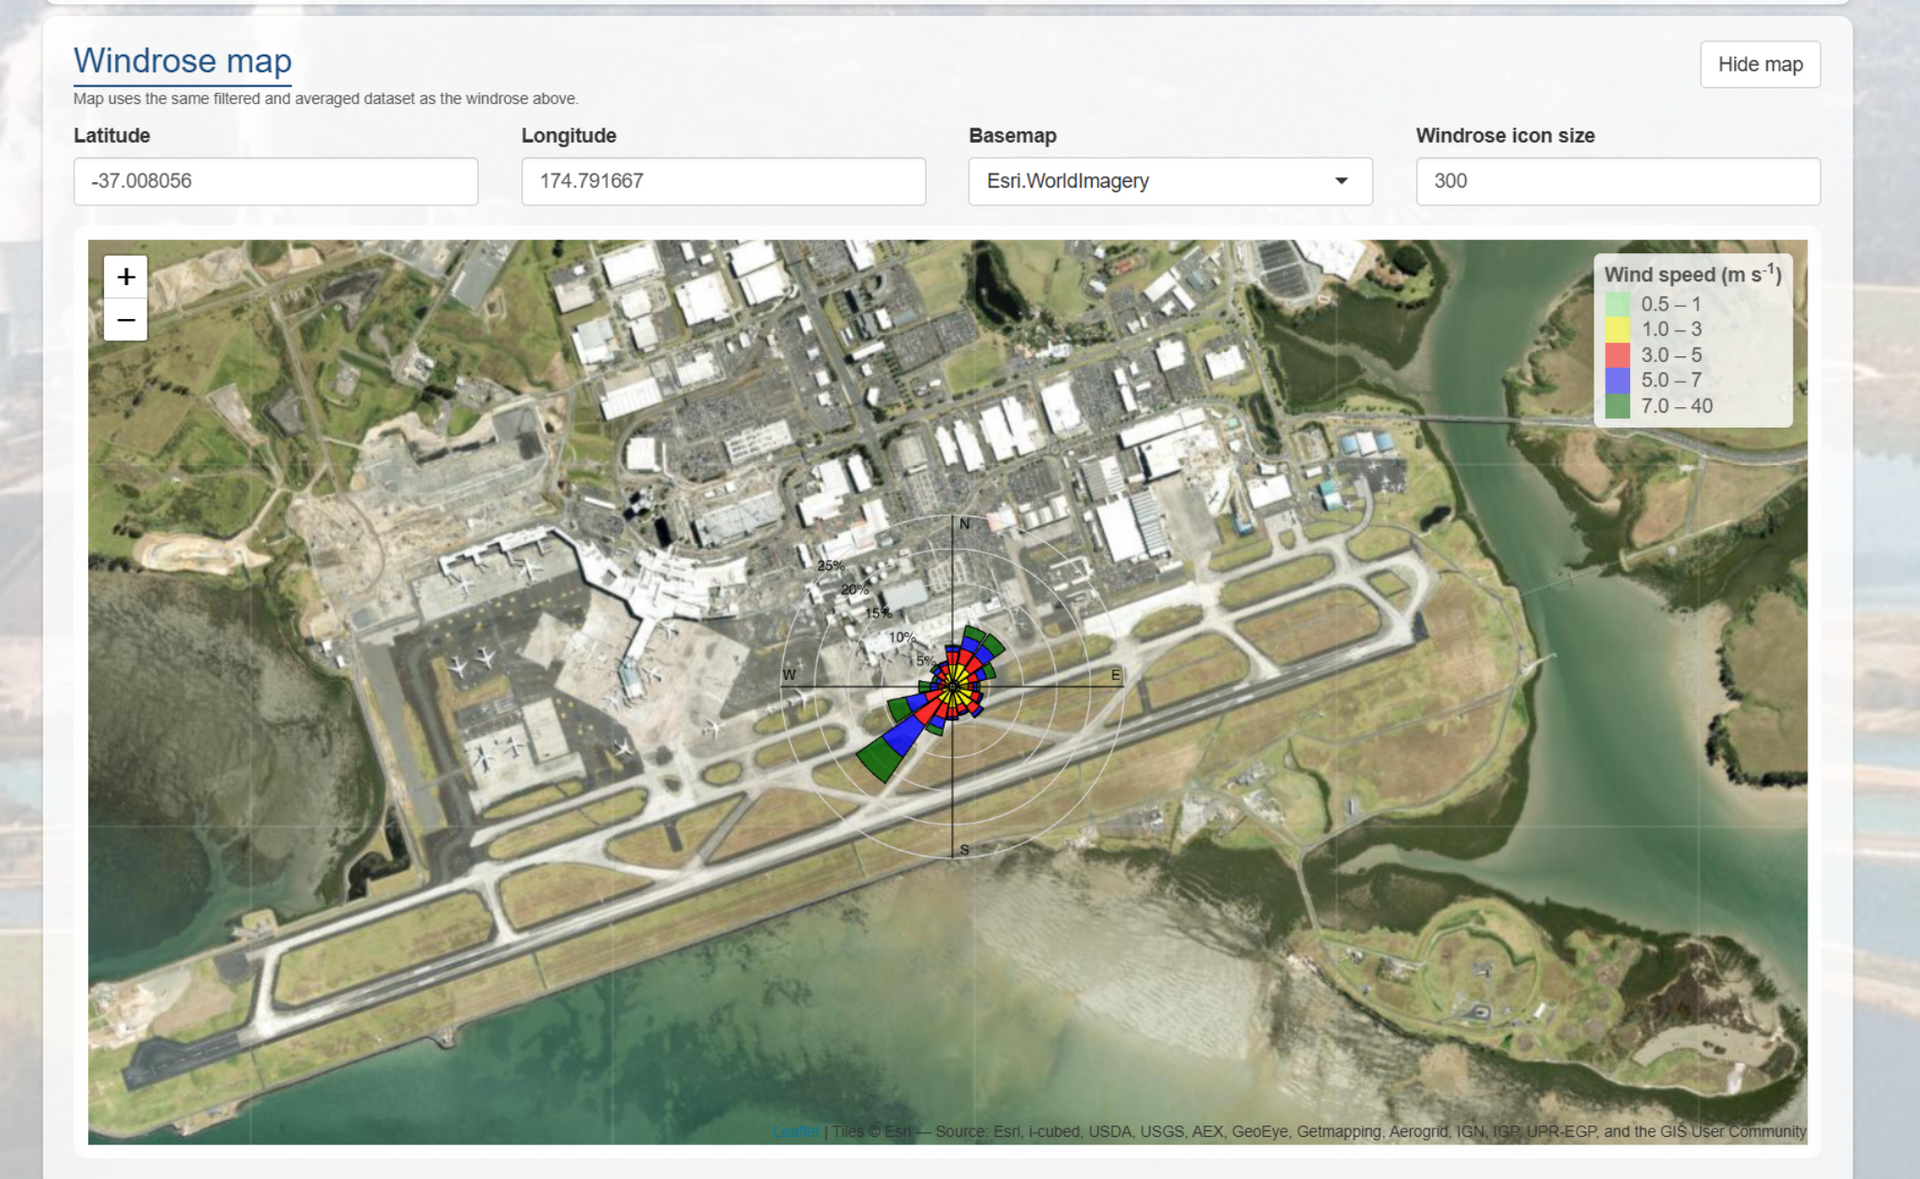
Windrose outputs can be visualised spatially over aerial imagery, providing context for site layout and surrounding features. This supports interpretation of wind patterns in relation to nearby sources and sensitive receptors.
Polar Plot Analysis
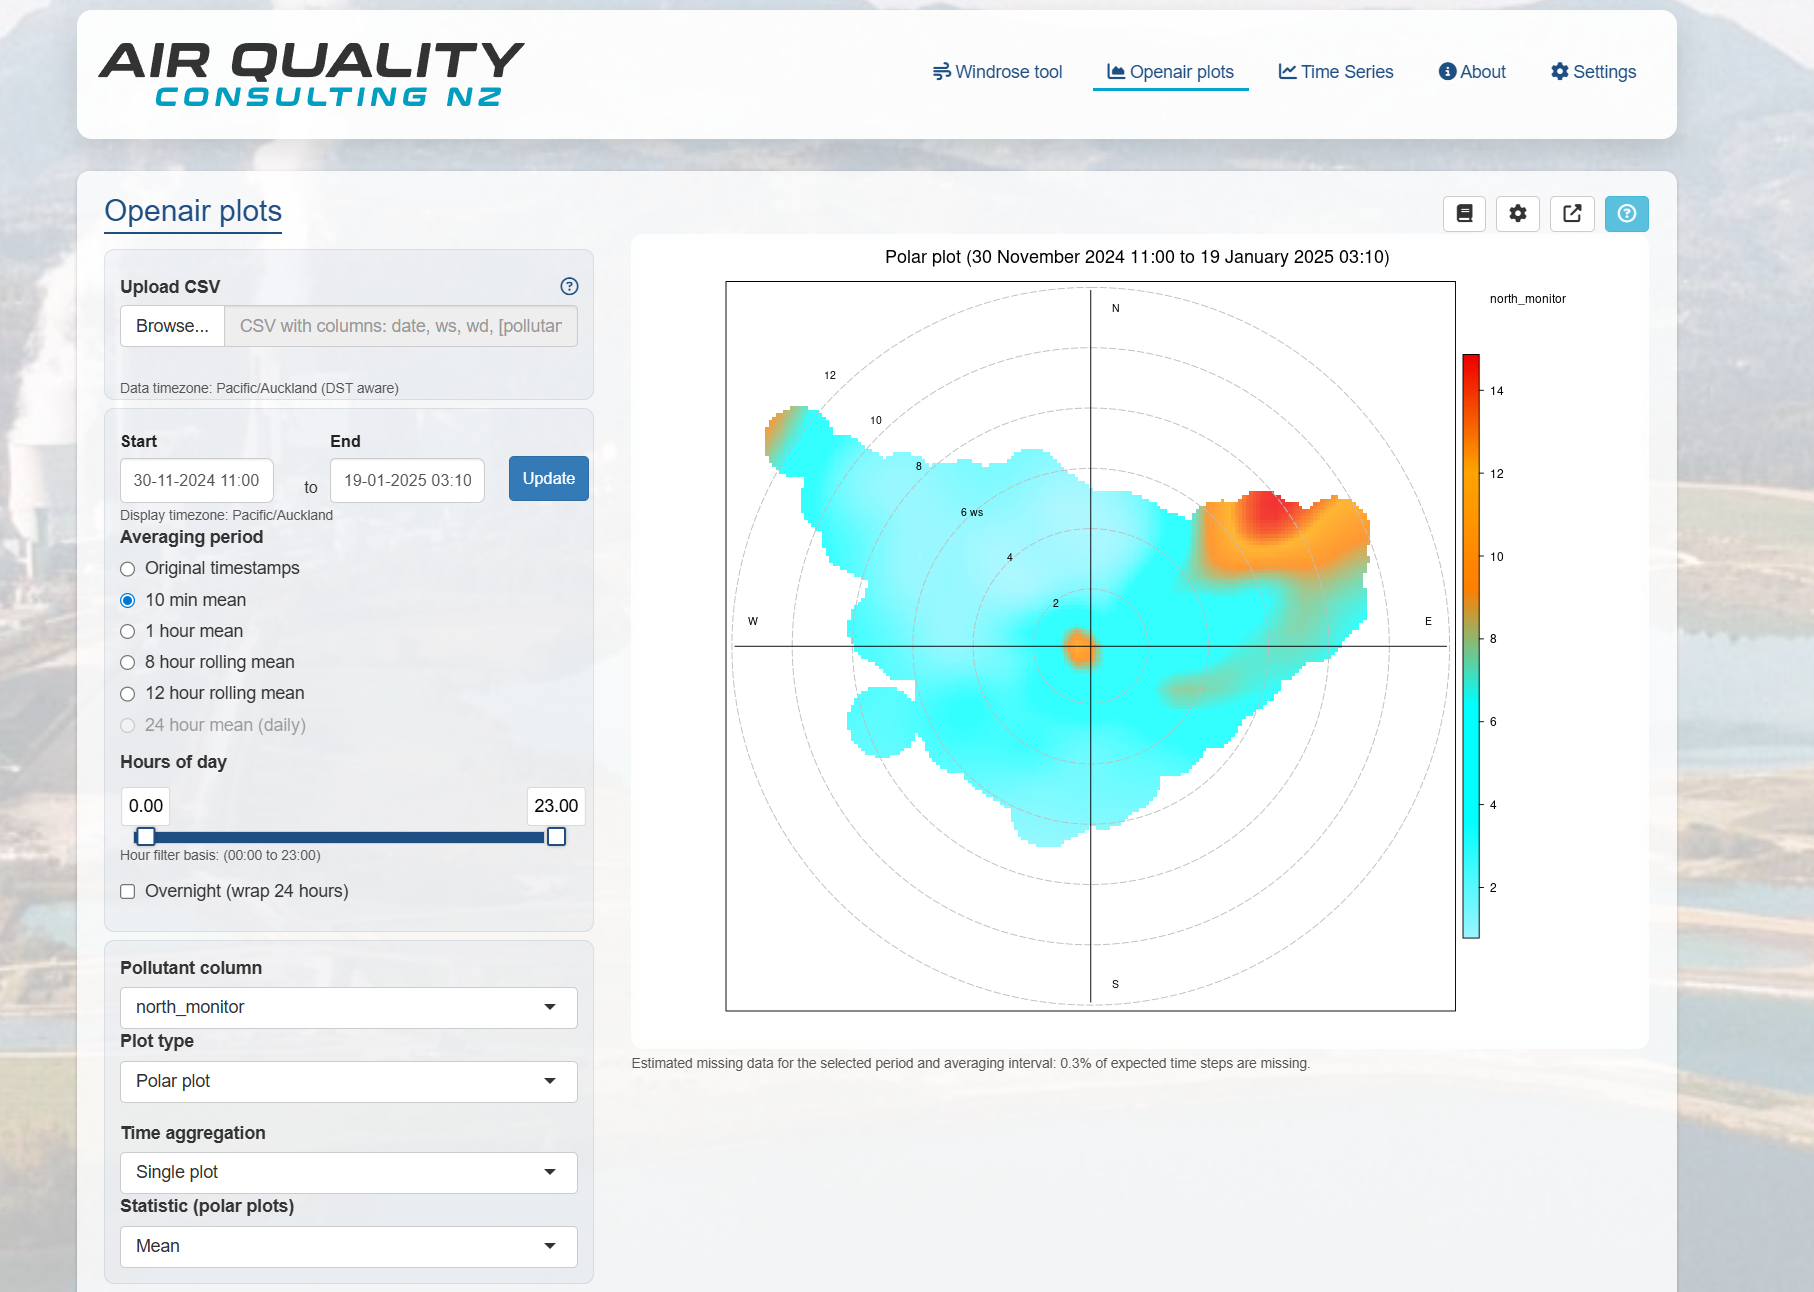
Polar plots combine pollutant concentration with wind direction and wind speed, enabling identification of potential source directions. This is a useful screening tool for understanding directional patterns in air quality data.
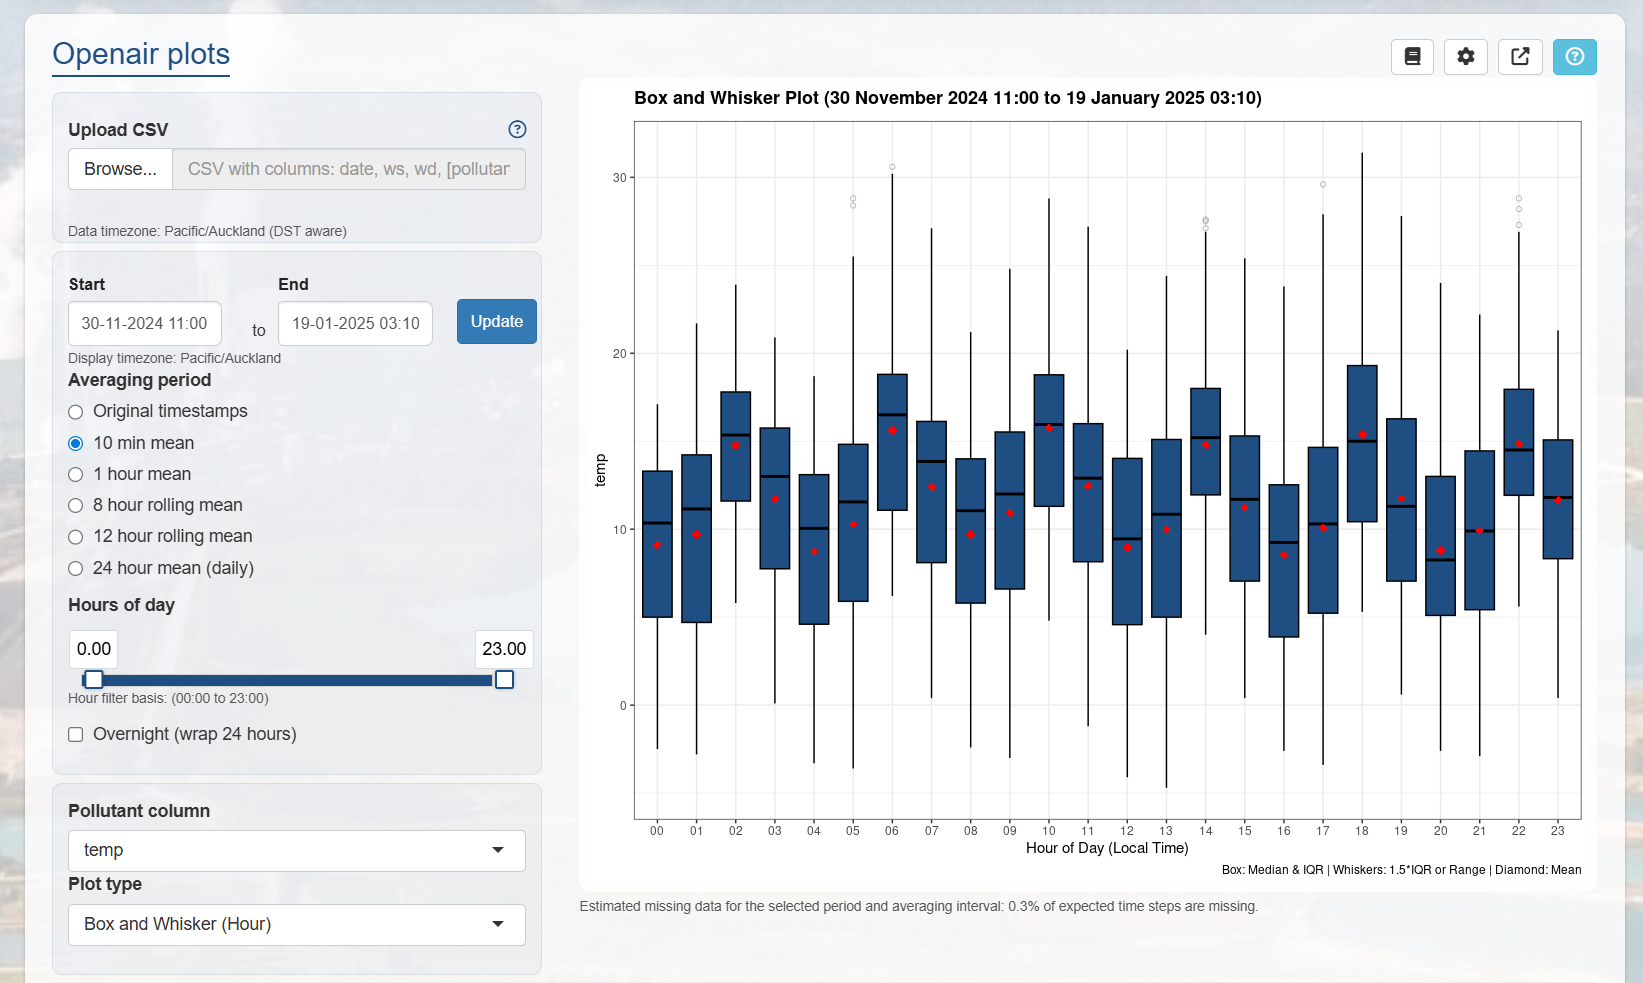
Statistical Data Analysis
Box and whisker plots are used to assess the distribution and variability of monitoring data over time. These plots support identification of trends, outliers, and typical operating conditions.
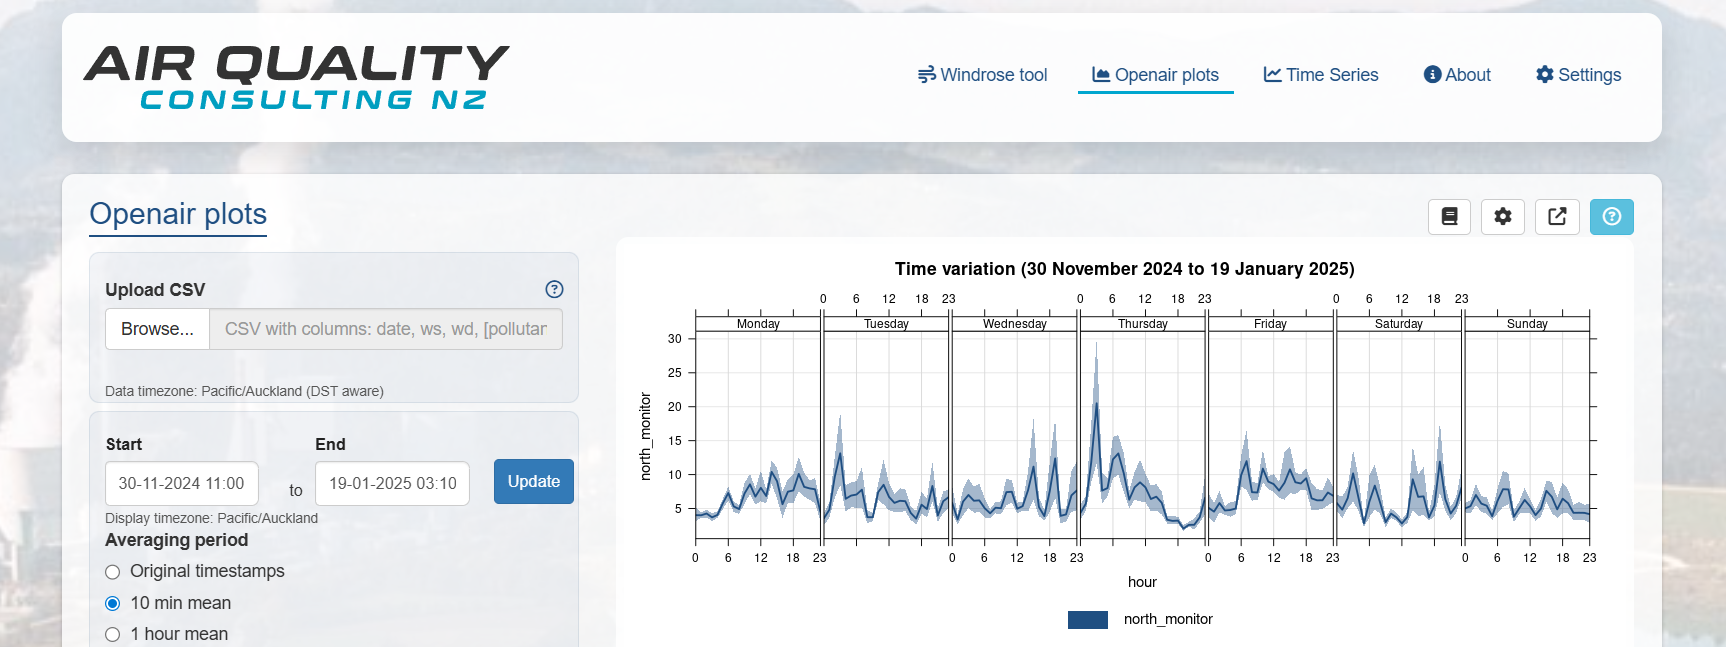
Time Variation Analysis
Time variation plots show how monitoring data changes over time, including daily and weekly patterns. These plots are useful for identifying recurring trends and understanding temporal variability.
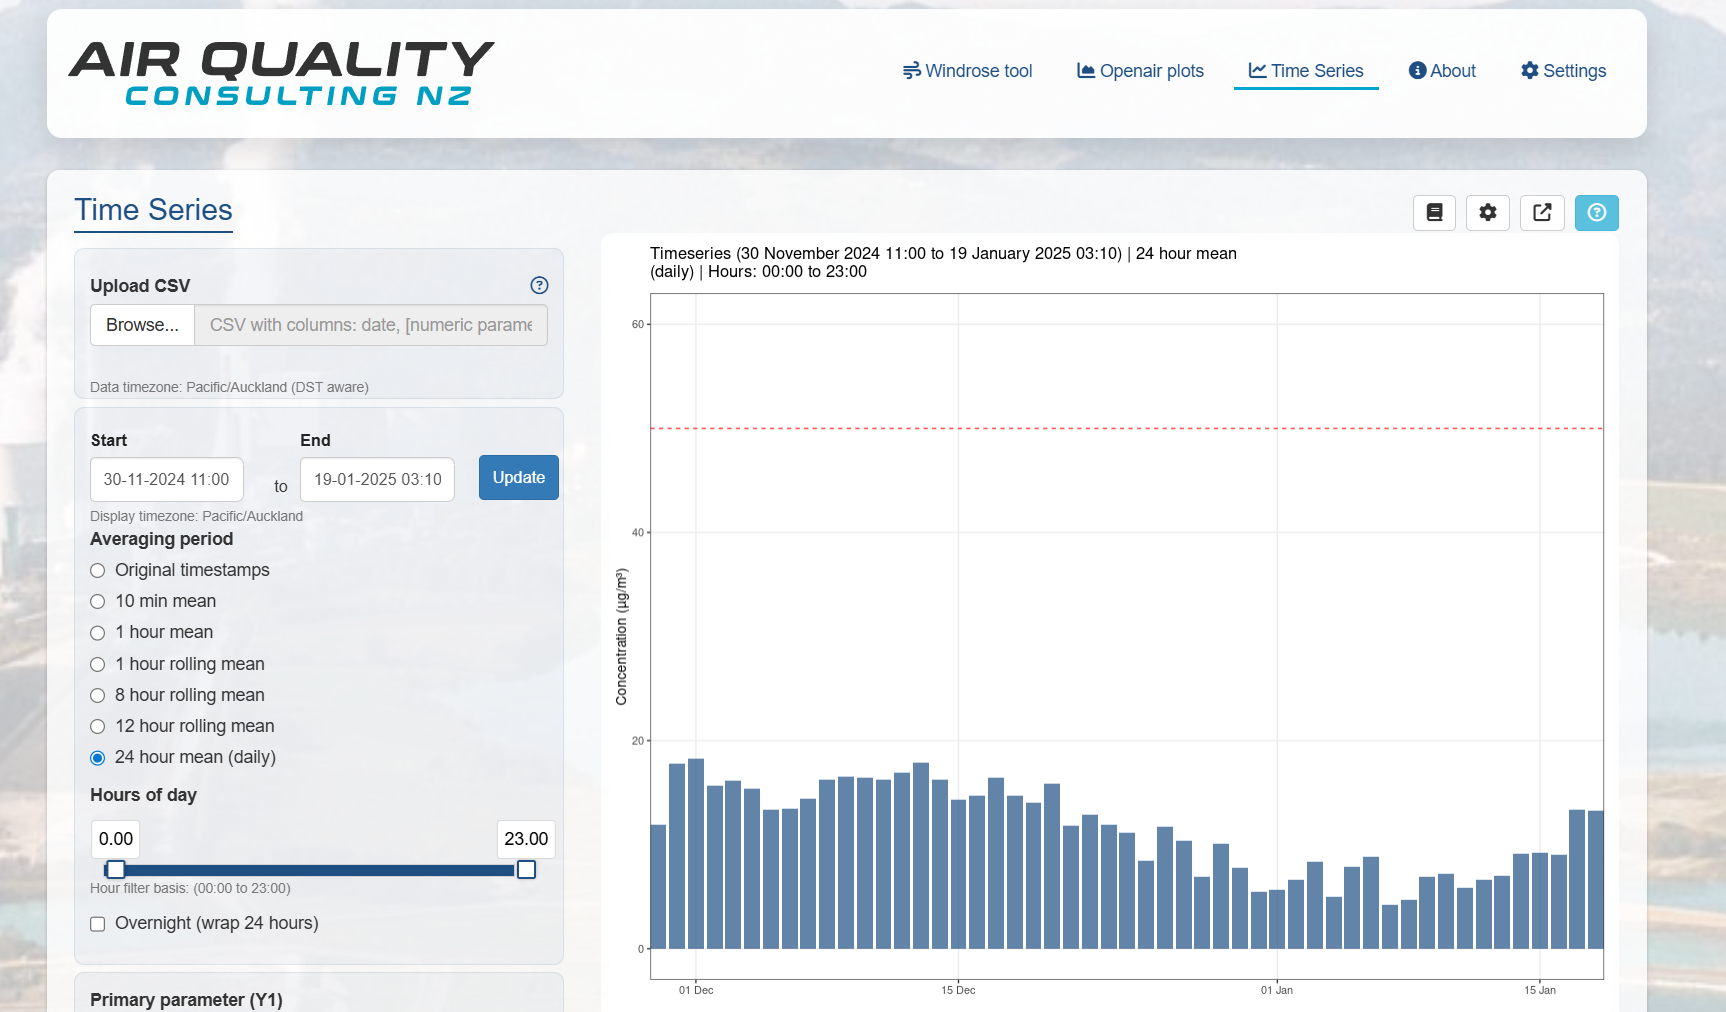
Time Series Analysis
The time series tool enables visualisation of monitoring data over time with support for multiple averaging periods. Thresholds can be applied to assist with compliance assessment and identification of exceedances.
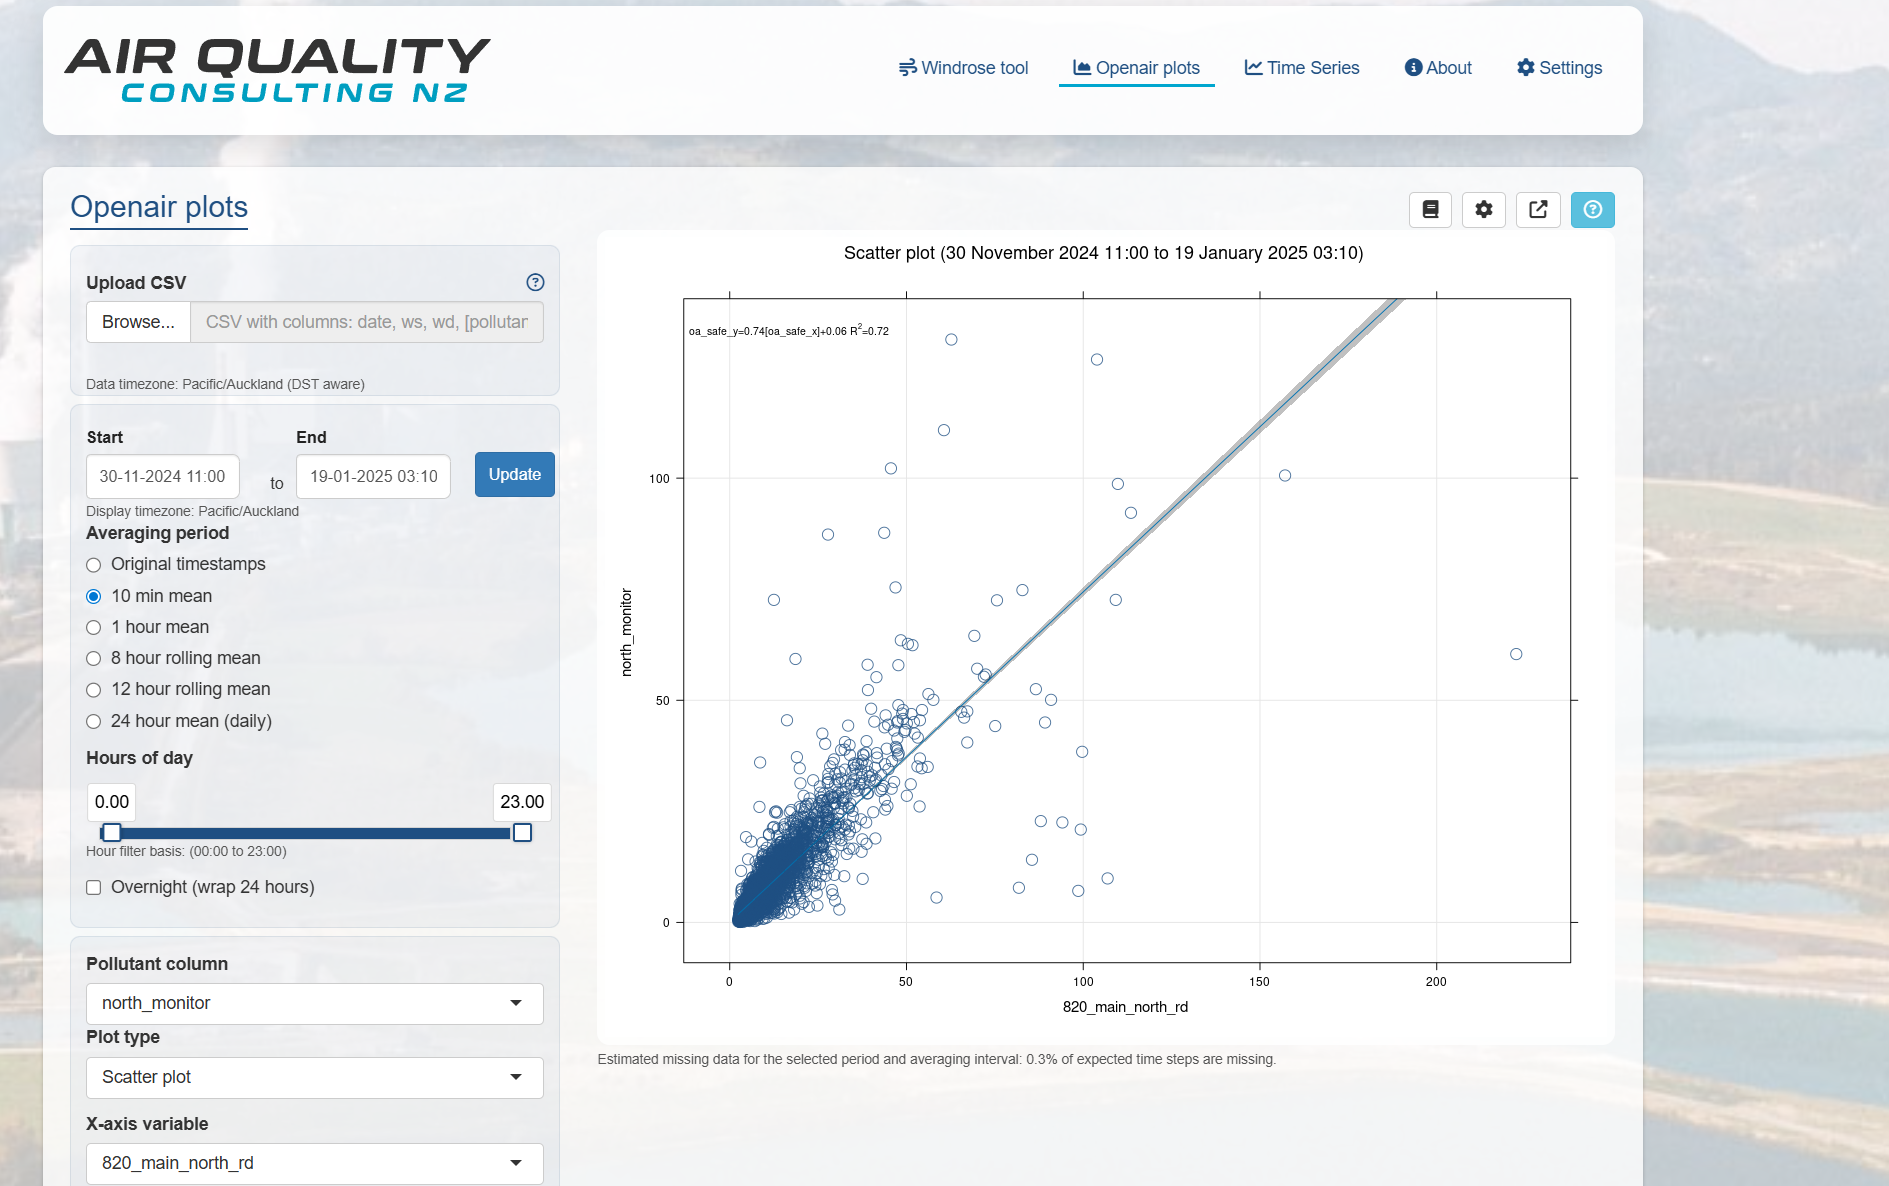
Scatter Plot
Scatter plots allow comparison between variables or monitoring locations, supporting correlation analysis and validation of monitoring data.